Read your model
What each page of a model shows, and what investors will look at first.
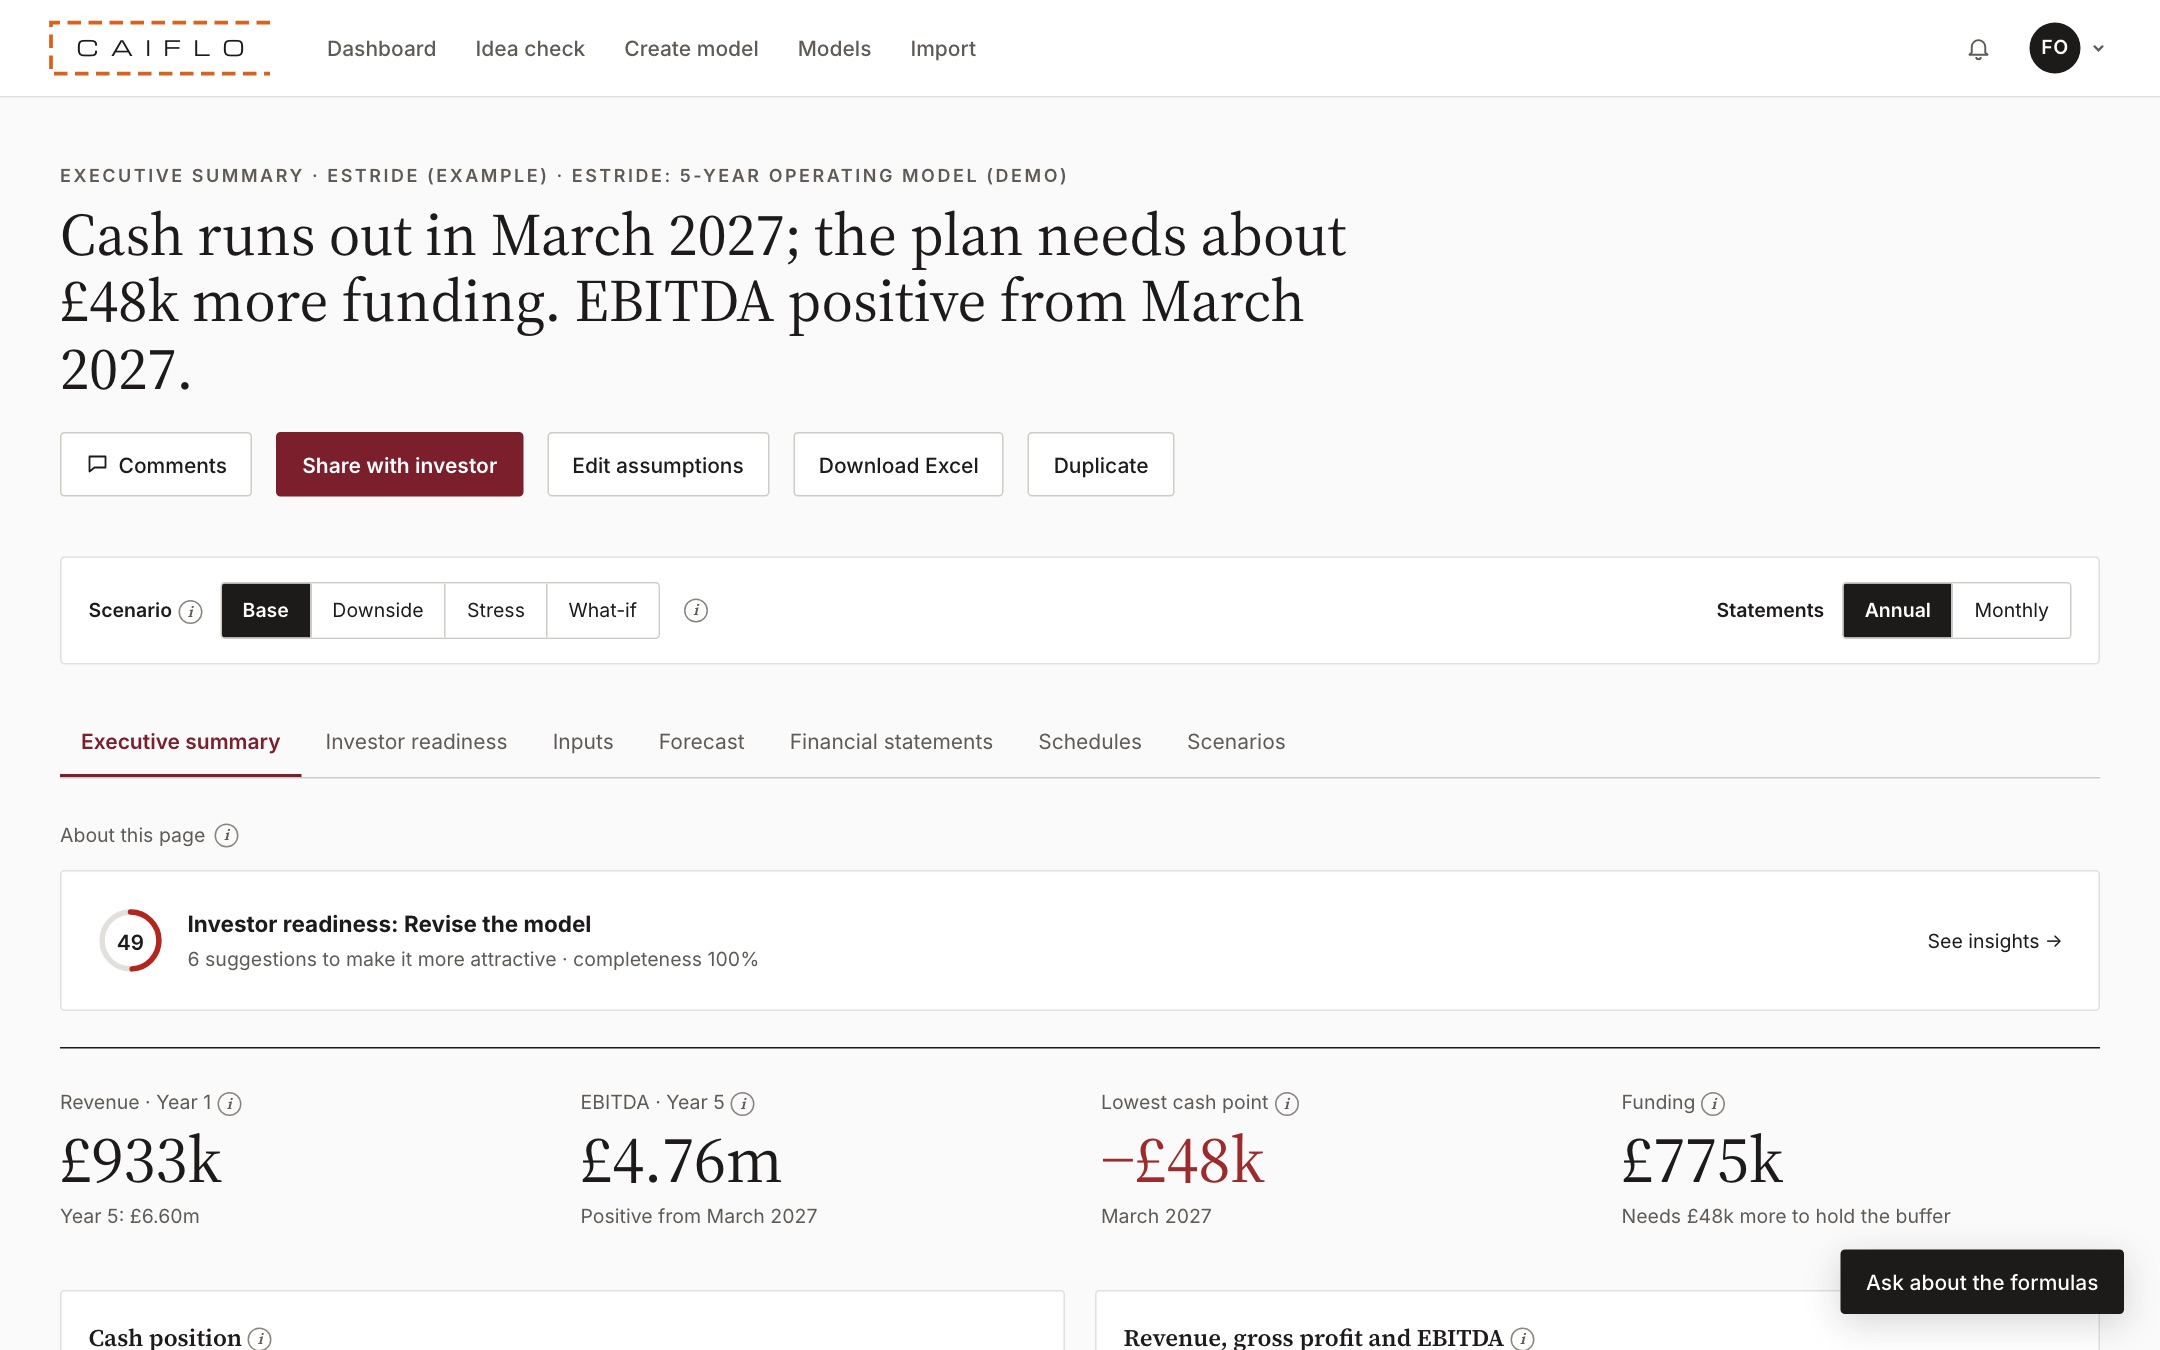
Executive summary and the ask
The page investors read first.
- Open a model from Models. You land on the Executive summary.
- The headline is a one-line verdict, for example "Cash runs out in March 2027; the plan needs about 48k more funding".
- The ask shows how much you're raising, each tranche with what it delivers, and the runway it buys. Covered means the money lasts until the next round with at least three months to spare, Tight means less than three, and Runs out first means a gap.
- Below that are the key figures and charts: revenue, EBITDA, the lowest cash point and the cash line over time.
If a reader only looks at one page, it's this one. Make sure the ask, the runway and the headline tell the story you mean to tell.
Milestones
A timeline built from your numbers.
- Open Executive summary → Milestones.
- You'll see first revenue, launches, key hires, funding rounds (with what each delivers), the cash low point, break-even and profit, each marked reached, next or overdue.
- Add your own milestones, such as a certification or a big contract.
Investors back a plan they can track. A clear timeline makes it easy to agree what "on track" means, and to check progress later.
Investor readiness
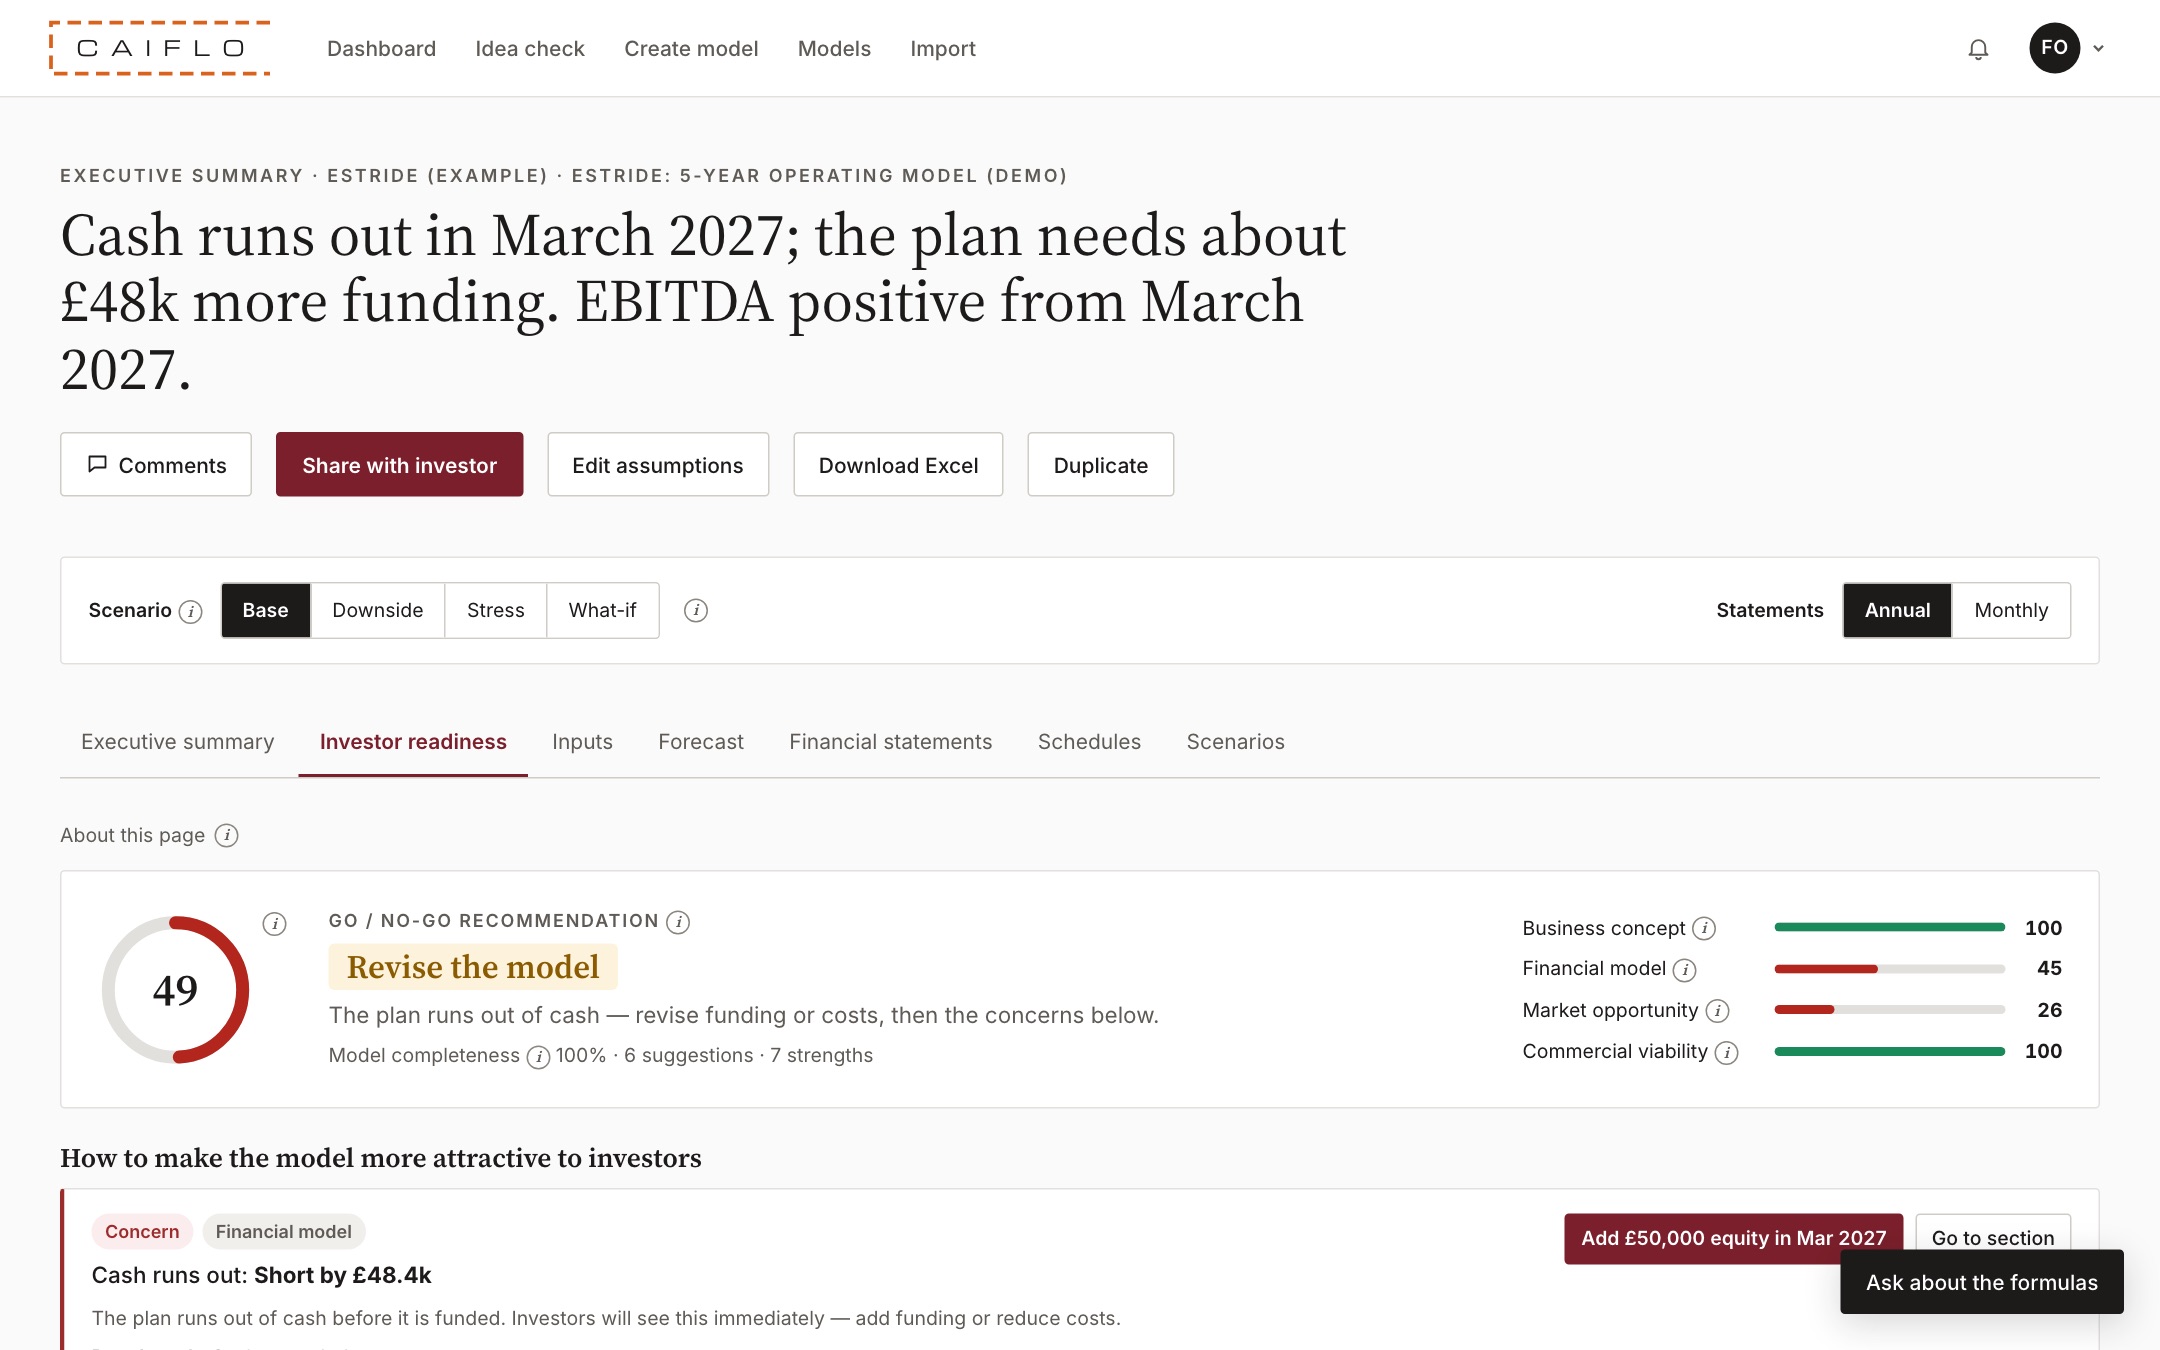
A score out of 100 and a list of what to improve.
- Open Investor readiness → Insights & score.
- The score comes from four areas: business concept, financial model, market opportunity and commercial viability. It ends with a recommendation: Invest, Pilot, Revise or Abandon.
- Each suggestion explains the problem, compares you with a published benchmark (with the source) and, where it can, offers a fix.
- Click a fix to apply it, or follow the link to the exact field in the editor.
It's the view an experienced investor would form in the first ten minutes. Working through the suggestions before you share is the quickest way to a better first meeting. See Investor readiness score.
Pre-investor check
A to-do list of what an investor's own checks would pick up.
- Open Investor readiness → Pre-investor check.
- Work down the list. Each item says what was found, why it matters and how to fix it.
Investors run their own checks on your model. This shows you the findings first, so you can fix them or have an answer ready. Only you see this page; investors never do.
Statements, schedules and the formulas behind them
The full monthly model, as a finance person would expect it.
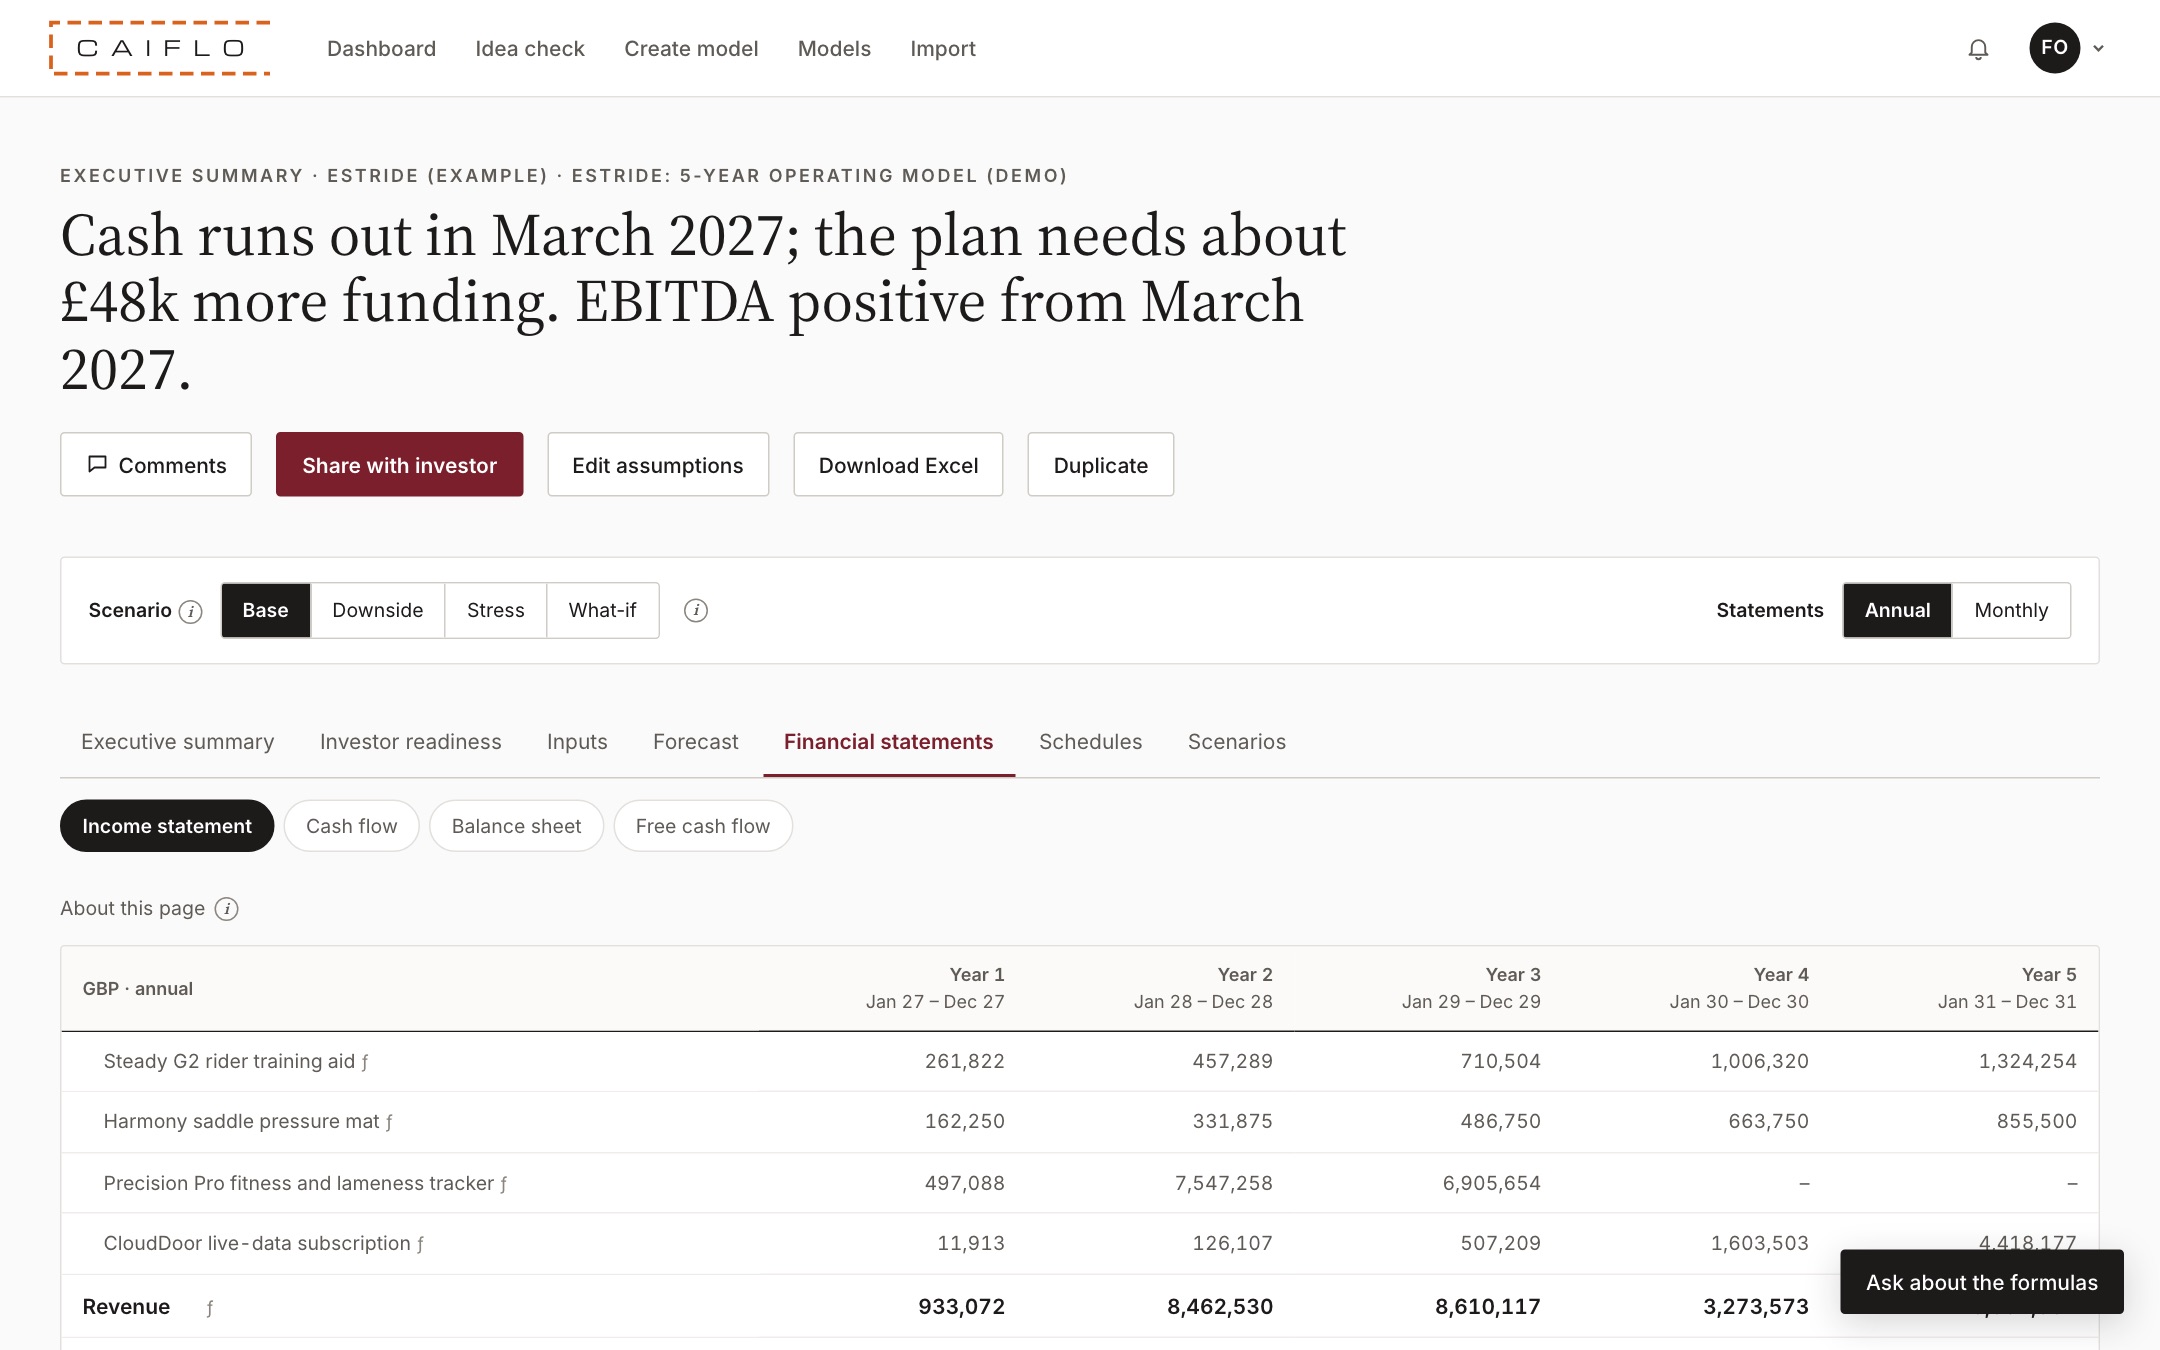
- Financial statements has the income statement, cash flow, balance sheet and free cash flow.
- Schedules has sales tax and corporation tax, funding and debt, fixed assets and working capital.
- Switch between Annual and Monthly at the top of each table.
- Click the (i) next to any line for a plain-English explanation, or ƒ to see exactly how it's calculated.
- Click Ask about the formulas (bottom right) to ask the Formula helper about any number, such as "why does cash dip in month 9?".
Being able to say how every number was worked out is what makes a model credible. Nothing here is a black box.
Scenarios and what-if
See what happens when things change.
- Use the Scenario switch at the top of the model: Base, Downside or Stress.
- Choose What-if to move sliders for volume, price, cost and overheads, and watch the numbers change. Nothing is saved.
- Scenarios → Scenario comparison puts all the cases side by side.
It answers the question every investor asks, "what if it goes worse than this?", without building a second spreadsheet.
Download to Excel
Take the model with you.
- Click Download Excel on the model page.
- The workbook has a cover, an Inputs sheet and every statement, with live totals.
- You can edit the Inputs sheet and import it back into Caiflo later.
Some investors and accountants want the spreadsheet. You can give it to them, and still keep one version of the truth in Caiflo.